
GBPUSD Technical Outlook
16 April 2018
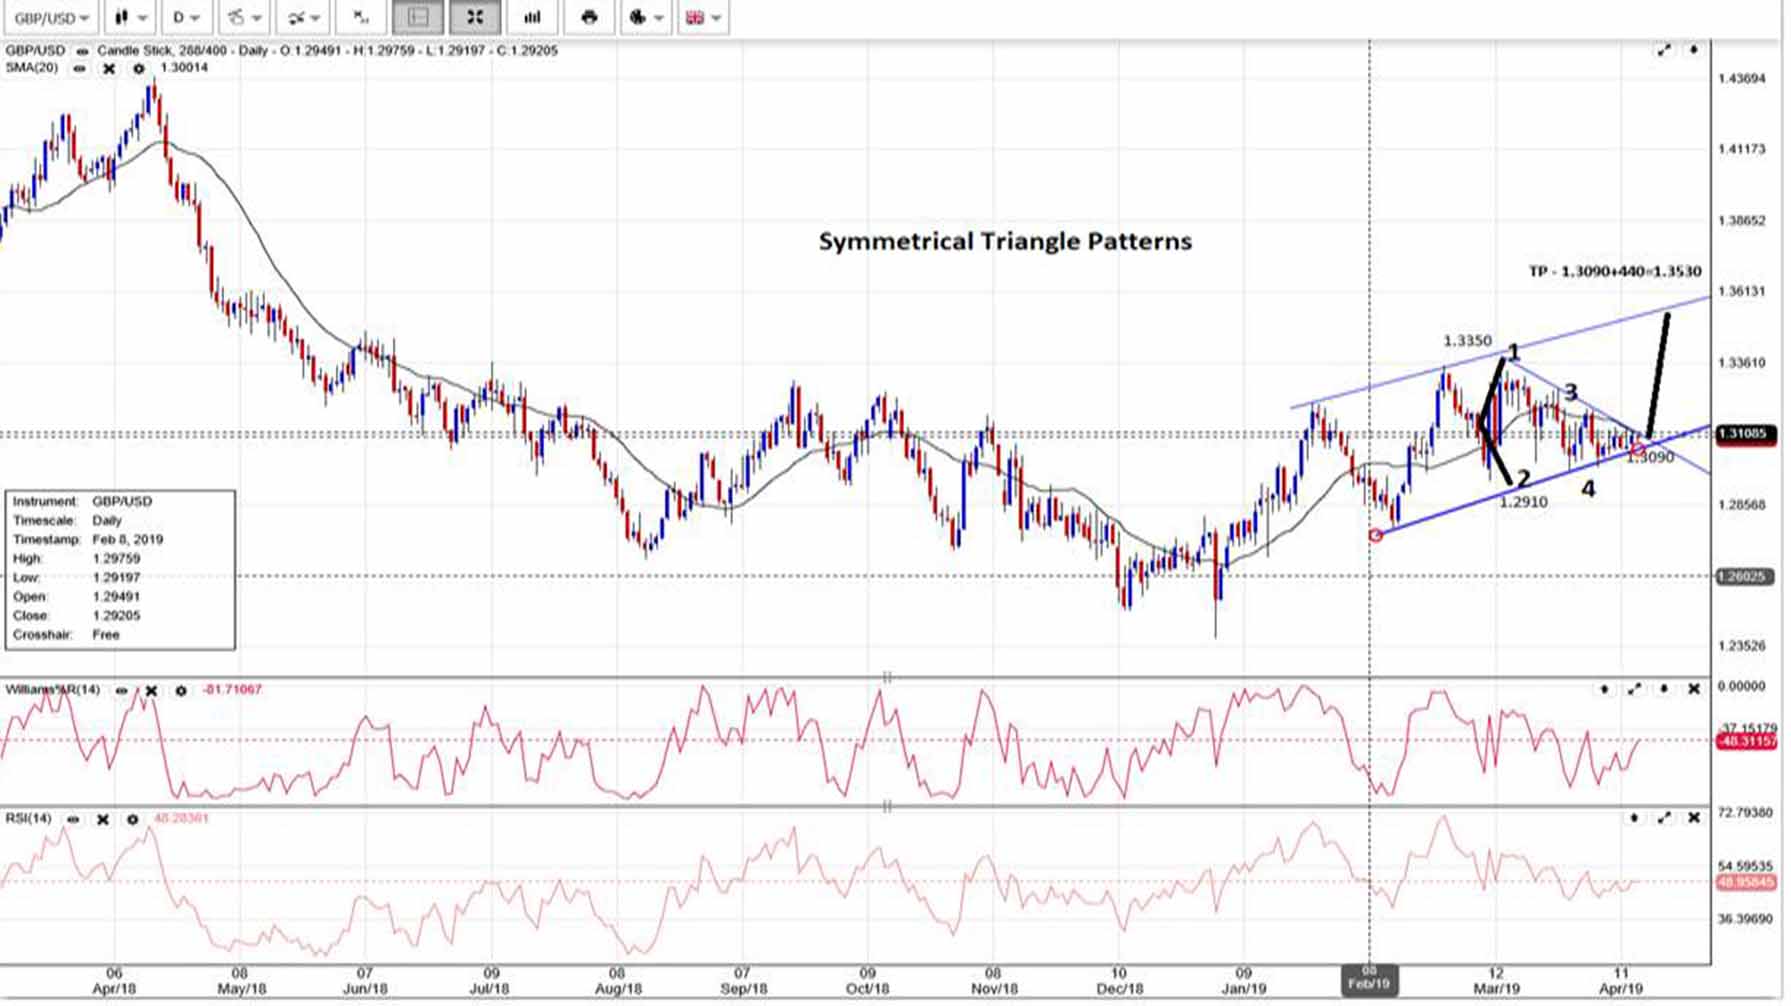
As we can see on chart GBPUSD declined from 1.3350 to 1.2910 in Feb 2019 and marked difference of 440 pips which would help to set target price once confirmed, market has formed symmetrical patterns. After formed first 2 points market is trading in boundaries and forming higher low & lower high which is showing symmetrical pattern formation and completed 4 points as upper line is sloping down and lower line is sloping up. A symmetrical patterns takes minimum 3 weeks in formation as below chart time duration is about 6-7 weeks which is good for this pattern. Momentum indicator (RSI & William%) showing the uptrend that would help to breakout the upper trend line at 1.3130 levels and confirmed the view. Once 1.3130 breaks our target is 1.3530 (1.3090+440).
Disclaimer: This report has been prepared by the research team and information contained therein should not be considered as "research" as that term is defined by applicable regulations from the company and views referred will not be considered as binding on any client or individual. Information has been collected from sources believed to be reliable and in good faith by the research team , but no representation or warranty, expressed or implied, is made as to their accuracy, completeness or correctness. The information may include opinions, estimates, indicative rates, terms, price and projections which reflect existing market conditions and are subject to change, modification or amendment without any prior notice and may vary from views expressed by other members and reports of the company. While care has been taken in compiling this publication, RouteForex, is unable to take any liability for the accuracy of its contents or any consequences of any reliance which might be placed on it. For details, contact us at, dealing desk on +91-011-29870614/13.